Jordan Station Real Estate Details
Properties For Sale & Real Estate
Search More Properties
Jordan Station

Search More Properties
Jordan Station
Jordan Station
Jordan Station Real Estate Statistics
Total Properties
4
Avg. Size in Sq. Ft.
1,921
Avg. Age in Years
0.3
Average Days on Site
94
Minimum Price
$814,900
Maximum Price
$1,199,000
Avg. Price
$1,015,970
Avg. Price per Sq. Ft.
$540
Recently Listed in Jordan Station
$1,099,990

3bds 3ba2,056sqftActive
6-2797 Red Maple Avenue, Jordan Station, ON L0R 1S0
MLS #: 40831866
JJN REALTY BROKERAGE INC.
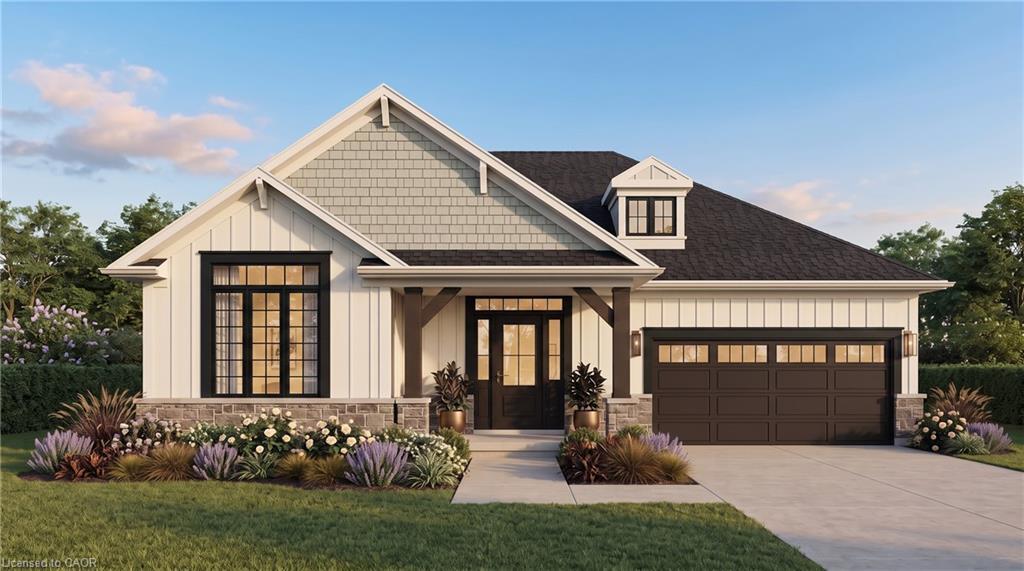
$949,990
2bds 2ba1,395sqftActive
12-2797 Red Maple Avenue, Jordan Station, ON L0R 1S0
MLS #: 40848605
JJN REALTY BROKERAGE INC.
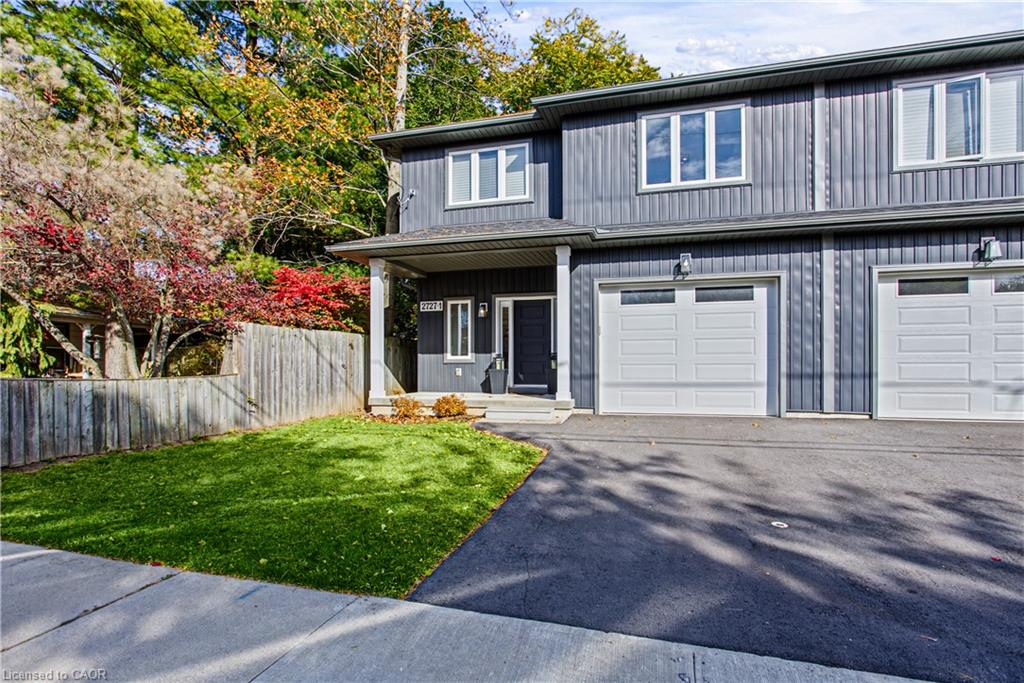
$814,900
3bds 3ba1,900sqftActive
1-2727 Prince William Street, Jordan Station, ON L0R 1S0
MLS #: 40875126
eXp Realty
Jordan Station Real Estate By Price
Demographic Information
Niagara County
211,341
Populations as of 2026106,596
Total Labor Force$67,809
Median Household Income$37,898
Per Capita Income43
Median Age2
Average Household Size19.1%
High School Graduate11.6%
Bachelor Degree Or HigherPopulation
2026 Estimate (V2026)
211,341
Age Distribution (Years Old)
0 to 4
5.1%
5 to 17
14.9%
18 to 64
59.9%
65 and Older
20.2%
Gender
Male
49.1%
Female
50.9%
Computer and Internet Use
Households with a computer
43.3%
Households with a broadband Internet subscription
43.3%
Language
English or Second Language, Age 5+
5.1%
English is First Language, Age 5+
89.8%
Veterans
Veterans
13,066
Housing
Total Housing Units
100,335
Households
91,493
Average Household Size
2 people
Owner-Occupied
30.7%
Multi-Family
0.8%
Owner-Occupied Median Value
$177,400
Median selected monthly owner costs - with a mortgage
$1,479
Median selected monthly owner costs - without a mortgage
$638
Median Gross Rent
$870
Year at Residence
1 Year or More
8.8%
Less Than 1 Year
91.2%
Business and Employment
Private non-farm Establishments
-
Private non-farm Employment
-
Nonemployer Establishments
11,830
Number of Firms
-
Business Production
Value of Shipments
-
Wholesale Trade
-
Retail Trade
-
Retail Sales Per Capita
-
Accommodation and Food Services
-
The American Community Survey (ACS) is an ongoing survey that provides data every year - giving communities the current information they need to plan investments and services. The ACS covers a broad range of topics about social, economic, demographic, and housing characteristics of the U.S. population. Much of the ACS data provided on the Census Bureau's Web site are available separately by age group, race, Hispanic origin, and sex. Summary files, Subject tables, Data profiles, and Comparison Summary
read more